Capex to Cash Flow Ratio: Why Is No Investor Using This Valuation Hack?
An Efficiency Ratio That Deserves More Attention
This publication is free. But if you find value in it, feel free to show your support with no more than the cost of your favorite coffee:
Dear Investor,
the evaluation of companies can be broken down into 3 questions:
1: How efficiently and profitably does the company operate?
2: How long can this efficiency be maintained?
3: What is the price I pay in relation to what I get?
These 3 questions must be clarified before a company is bought. All other questions are secondary. If I acquire a well-managed company at a fair price, and its competitive advantage allows it to maintain its business model in the long term, then the company's value is likely to appreciate over time.
Everything else you read and hear in the financial media is over-analysis that won't get you better results.
In today's article we will address the first question.
Free Cash Flow is the main driver of any long-term business performance, but there is a problem with its evaluation. I'll show it best with an example. To simplify matters, let's take 2 companies from the same sector:
McDonald’s vs. Yum! Brands
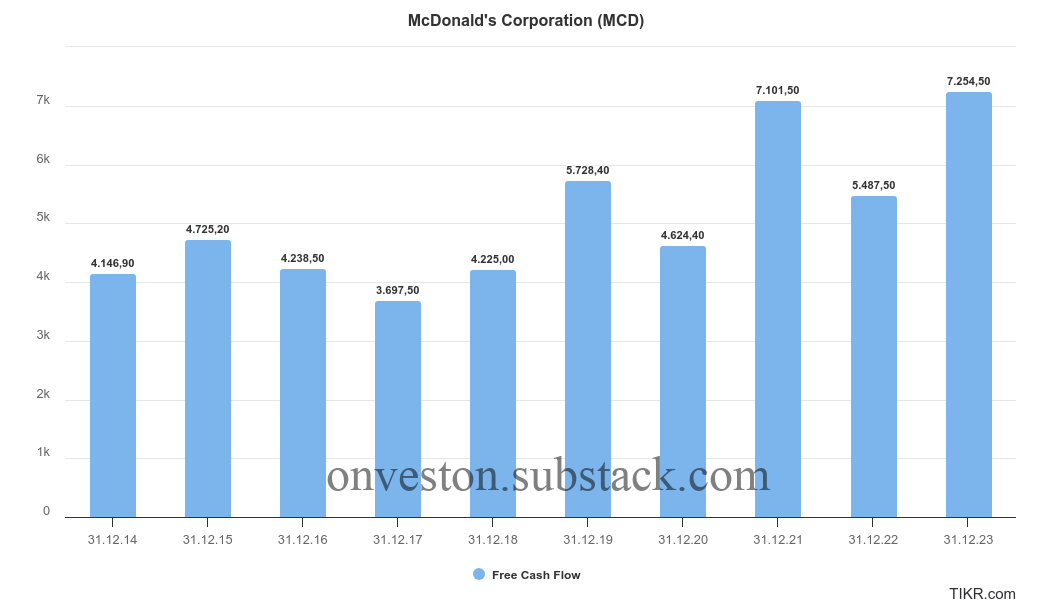
We’re going to take a look at how much Free Cash Flow each company generated in the last 10 years.
McDonald’s MCD 0.00%↑ Free Cash Flow:
Yum! Brands YUM 0.00%↑ Free Cash Flow:
Both companies have positive free cash flow with an upward trend.
We now know how much free cash flow each company generated, but not how efficiently it was generated.
To figure that out we need to take a look at their CapEx and their Operating Cash Flow:
CapEx (short for Capital Expenditures or Capital Expenses) can be translated as investment expenditure. It describes a company's expenditure on important goods in order to maintain or increase future performance. Typical expenditures that can be considered CapEx are the purchase of machinery, buildings and equipment. The repair and retrofitting of machinery and technology is also considered a capital expenditure.
Operating Cash Flow reflects the amount of cash a company produces from its regular activities, such as sales of goods or services, after accounting for the operating expenses like wages, rent, and inventory costs, but before any capital expenditures like purchasing machinery or property.
What we want to find out is quite simple:
How much CapEx is needed in any given year to generate how much Operating Cash Flow?
Therefore, let's take a look at the respective figures of the two companies:
The rules of investing are always the same, regardless of whether a company is listed publicly or not.
What you want as an investor is a capital-light company that requires little money to run and spits out a disproportionately high amount of cash - the ideal long-term investment.
Which brings us to the CapEx to Cash Flow Ratio.
While the Free Cash Flow numbers informs us about the total amount of excess cash, the CapEx to Cash Flow Ratio tells us how efficiently Free Cash Flow was generated:
CapEx to Cash Flow Ratio = CapEx / Operating Cash Flow
Let’s run the numbers.
McDonald’s CapEx to Cash Flow:
2014: 0,38 = 38%
2015: 0,28 = 28%
2016: 0,30 = 30%
2017: 0,33 = 33%
2018: 0,39 = 39%
2019: 0,29 = 29%
2020: 0,27 = 27%
2021: 0,22 = 22%
2022: 0,26 = 26%
2023: 0,25 = 25%
Yum! Brands CapEx to Cash Flow:
2014: 0,42 = 42%
2015: 0,35 = 35%
2016: 0,34 = 34%
2017: 0,31 = 31%
2018: 0,20 = 20%
2019: 0,15 = 15%
2020: 0,12 = 12%
2021: 0,13 = 13%
2022: 0,20 = 20%
2023: 0,18 = 18%
How do we interpret those numbers?
Keep in mind that that I don't know if it is an "official" evaluation method. This formula came to mind when I was analyzing stocks and noticed a connection between low capital expenditure and good share performance.
So I can only tell you what my rule is and what value is a purchasing criterion or exclusion criterion for me.
I have 3 rules:
The number has to be as low as possible
The result must be consistenty low with no big fluctuations
Any business whose CapEx/Cash Flow Ratio is consistently over 30% is of no interest to me
A company should be financially flexible to handle surprises that arise sooner or later:
Inflation
Bad economy
New competition
The need for expansion
Therefore, the operational business must be lean in order to not be dependent on debt and to produce excess free cash flow for its shareholders.
We can see that both of these companies operate efficiently, although Yum! Brands has improved noticeably over the last 5 years.
This is also reflected in the share price performance of both companies.
To understand why this formula is so revealing, we need to look at the opposite of an efficient company from the same sector: Cracker Barrel CBRL 0.00%↑
Cracker Barrel has been Free Cash Flow positive in the last 10 years (with 2020 being the exception due to the lockdown restrictions), but the main reason for their poor performance is inefficiency.
Here are Cracker Barrel’s CapEx to Cash Flow numbers for the last 10 years:
2015: 0,27 = 27%
2016: 0,42 = 42%
2017: 0,34 = 34%
2018: 0,46 = 46%
2019: 0,38 = 38%
2020: 1,84 = 184%
2021: 0,23 = 23%
2022: 0,48 = 48%
2023: 0,51 = 51%
2024: 0,75 = 75%
It’s no surprise that the company is not rewarding shareholders when they barely have their costs under control.
When the business struggles to generate excess cash, then all other problems follow.
And the beauty of this simple ratio is that if gives every investor a quick overview about what matters: How much cash is needed to generate X amount of cash.
The less, the better.
If you would like to know more about this key ratio and other similar ones that I use then let me know with a like ❤️ and I will go into more detail about it in the next articles.
I hope you learned something new today.
Until the next issue. 👋
Premium Content 📈
Every month, I introduce a handpicked elite business model that stands out for its strong fundamentals, competitive moat, and growth potential.
Backed by in-depth analysis, each recommendation is carefully chosen to help you build wealth sustainably over time.
Don’t just follow the market—get ahead of it with strategies tailored for serious, patient investors who seek consistent, long-term success.
Get the latest report today and gain the edge you need during uncertain times.
To give you a taste of what to expect, here is the CapEx to Cash Flow Ratio for the stock from the latest report:
2015: 0,08 = 8%
2016: 0,09 = 9%
2017: 0,11 = 11%
2018: 0,08 = 8%
2019: 0,06 = 6%
2020: 0,06 = 6%
2021: 0,06 = 6%
2022: 0,06 = 6%
2023: 0,05 = 5%
2024: 0,05 = 5%
To get access to the report of this elite business, read the introduction and then click the link at the end of the article:
The next report is getting prepared, stay tuned!
Appreciate my unique take on stock investing? Consider donating the price of a coffee to keep these insights coming:
If you enjoy The Onveston Letter, let me know by clicking the “Like” button ❤️.
And if you aren’t a subscriber yet, then sign up below to not miss out on future articles.
For new readers: Check out all my previous posts here
Disclaimer: This analysis is not advice to buy or sell this or any stock; it is just pointing out an objective observation of unique patterns that developed from my research. Nothing herein should be construed as an offer to buy or sell securities or to give individual investment advice.
Thumbnail credits: https://www.vecteezy.com/free-vector/cash-flow-statement


There's a very simple explanation for the differences in this ratio between McDonalds, Yum and Cracker Barrel - the degree of franchising. McDonalds is 93% franchised, Yum 98%, and Cracker Barrel not at all.
Excellent. Years ago there was a push from an activist for MCD to spin-off their real estate into a REIT.
Yum was spun out of Pepsi and was originally called Tricon Global. It was renamed and then years later Yum spun out Yum China YUMC, which has also done well post spin-off, but not so well the past couple of years, although both continue to raise their dividends as does MCD.