


Decades of Dominance: The Investing Strategy That Almost Never Loses
A Quantitative Approach to Tactical Asset Allocation

Hi Everyone,
One of the main challenges faced by stock investors are market selloffs and the emotional overreactions that often accompany them. When the market drops a lot, it's not uncommon for investors to give in to fear, panic, and uncertainty, making them sell their stocks at the wrong time.
This emotional reaction, motivated by a desire to safeguard investments from further losses, harms long-term investing success. When investors sell at the wrong time when prices are falling, they violate the principle of buying low and selling high. Instead, they lock in losses and risk missing out on market rebounds.
In theory, it’s easy to make the right decisions, but in practice not. Therefore I’m a big proponent of systematic investing. This brings us to today’s topic: I want to introduce you to a research paper called “A Quantitative Approach to Tactical Asset Allocation” from Meb Faber.
The author presents a simple investing system that can achieve stock-like returns with bond-like volatility. Basically smoothing out the inevitable ups and downs of the market. The heart of this investing strategy is based on a trading system that’s been around for decades, namely the 10-Month Simple Moving Average.
The 10-Month SMA is simply the average closing price of a stock over the last 10 months. It’s commonly used in stock trading to determine the general market trend. As long as a stock price remains above the 10-Month SMA on the daily time frame, the stock is generally considered to be in an overall uptrend, and vice versa.
Before we get to the details, let’s take a look at how stocks generally perform above and below the 10-Month SMA:
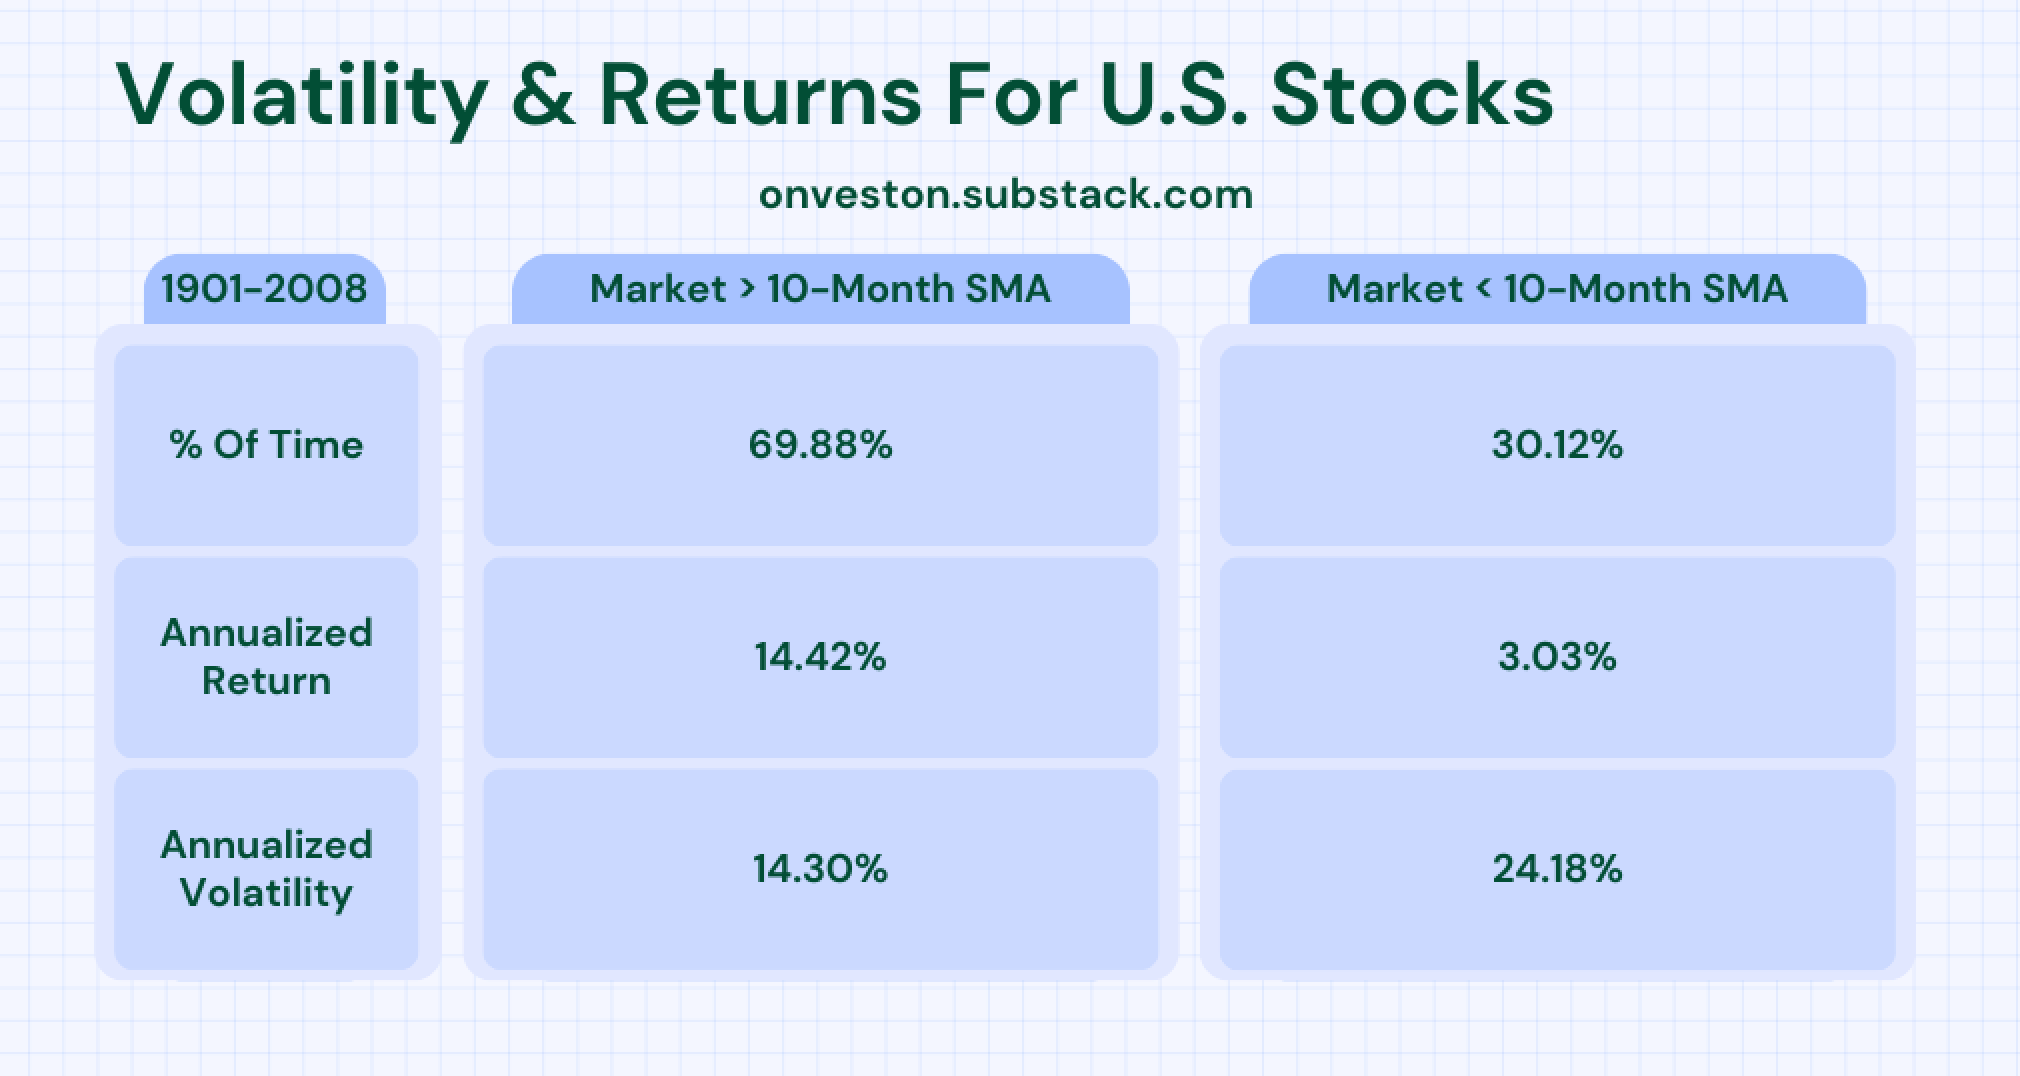
From 1901-2008 stocks produced an annualized return of +14.42% and a volatility of 14.30% when the market was above the 10-month SMA and a +3.03% annualized return with a volatility of 24.18% when the market was below its 10-month SMA.
This means that being invested above the 10-Month SMA you get better returns with less risk while being invested below the 10-Month SMA gets you worse returns with higher risk.
So, how would the overall performance look if we just buy the S&P 500 when the odds are in our favor and stay in cash when the odds are against us?
This strategy is interesting because of its simplicity:
It’s simple enough to understand.
Rule-based to remove human emotion.
And successful enough to justify its implementation.
And it consists of only 2 rules:
BUY RULE
Buy when monthly price > 10-month SMA.
SELL RULE
Sell and move to cash when monthly price < 10-month SMA.
For illustration purposes:

Here are the results from 1900-2005:

Not only did this strategy outperform (by almost 1% per year), but it also allowed investors to reliably sidestep the equity market and stay in cash during bear markets, thereby reducing portfolio volatility and boosting risk-adjusted returns.
The biggest drawdown was -49.98% and the worst year ended with -26.69%. Considering that the timeline of this backtest is more than 100 years which included the great depression, recessions, and several market crashes, it has stood the test of time quite well. Investors could capture the upside potential through downside protection while keeping their cool during market turmoil.
Because bear markets are stressful and tempt investors to throw in the towel at the wrong moment (selling low), promising themselves that they will never invest in any stocks again, let’s take a look at how this strategy performed during the worst 10 years:

Although this is a very simple investing strategy that is based solely on the price of the S&P 500 SPY 0.00%↑ and not on fundamentals, the results are still impressive.
Out of the 10 worst years, the timing strategy only closed 6 times with a loss, giving investors peace of mind while the market tanked between -14.65% and -43.86%. 4 of those years closed even with a small gain even though the market ended with with double-digit losses.
Final Thoughts
While this strategy is far from perfect it shows investors that a strategic approach to investing is superior to listening to the meme advice from financial bloggers (“Just buy an index fund, bro.”) Even with an average asset class like the S&P 500 you can improve your results with a simple rule-based system.
When I looked at the fact that most fund managers underperform their benchmark while still charging fees for their “service”, and many retail investors perform even worse, I asked myself:
"How is this possible when there is so much information about investing available?"
Even though investor psychology is a big part of the answer, I think a bigger reason for poor performance is that investors still think in absolutes. Here are a few examples to help you understand what I mean:
“Is this the best stock now?”
“Is now a good time to buy?”
“What’s the cheapest stock right now?”
“Is the market overvalued?”
and so on…
Financial media is full of it.
The more effective way to invest is to think about probabilities (what are the odds?) and implement strategies based on those. Timing the market based on the 10-month SMA is just one of many strategies investors can use.
By understanding the probabilities at play and taking a disciplined approach to investing, investors can handle market downturns better and increase their chances of meeting long-term financial goals.
I you want to learn more about other similar methods in future articles, let me know by clicking the “Like” button ❤️.
Until the next issue. 👋
If you aren’t a subscriber yet, then sign up below to not miss out on future articles.
Disclaimer: This analysis is not advice to buy or sell this or any stock; it is just pointing out an objective observation of unique patterns that developed from my research. Nothing herein should be construed as an offer to buy or sell securities or to give individual investment advice.
Do you make investment changes the day of/day after the cross, or only at the end of a calendar month, since the switch is based upon a monthly moving average?
Thank you