This Strategy Never Lost in 33 Years
A Quantitative Approach to Tactical Asset Allocation (Part 2)
Dear readership,
this article is a continuation of a previous one (Decades of Dominance). New readers can read it here for a better understanding:
In the last article, we found out that a simple timing strategy based on the S&P 500 SPY 0.00%↑ 10-month simple moving average can reduce the risk significantly and deliver outperformance by around 1% per year.
And that’s with just one asset class.
But how would a diversified portfolio perform using the same timing strategy?
What happens if we bring international stocks, commodities, real estate, and bonds into the game? The author of the paper backtested an equal-weighted portfolio with the following asset classes:
U.S. stocks (S&P 500)
Foreign stocks (MSCI EAFE)
U.S. bonds (10-Year Treasuries)
Commodities (Goldman Sachs Commodity Index)
Real Estate (NAREIT)
Here are the rules:
The portfolio is equally weighted across all asset classes (20% each).
Each asset class is treated independently.
If the price moves below the 10-month sma (sell signal), the asset class gets replaced by cash.
If the price moves above the 10-month sma (buy signal), the investor is long the asset class.
The portfolio is rebalanced monthly to keep the 20% allocation to each asset class. Although (as the paper states) it would make little difference with a yearly rebalancing.
The timeframe is from 1972-2005.
Here are the results:
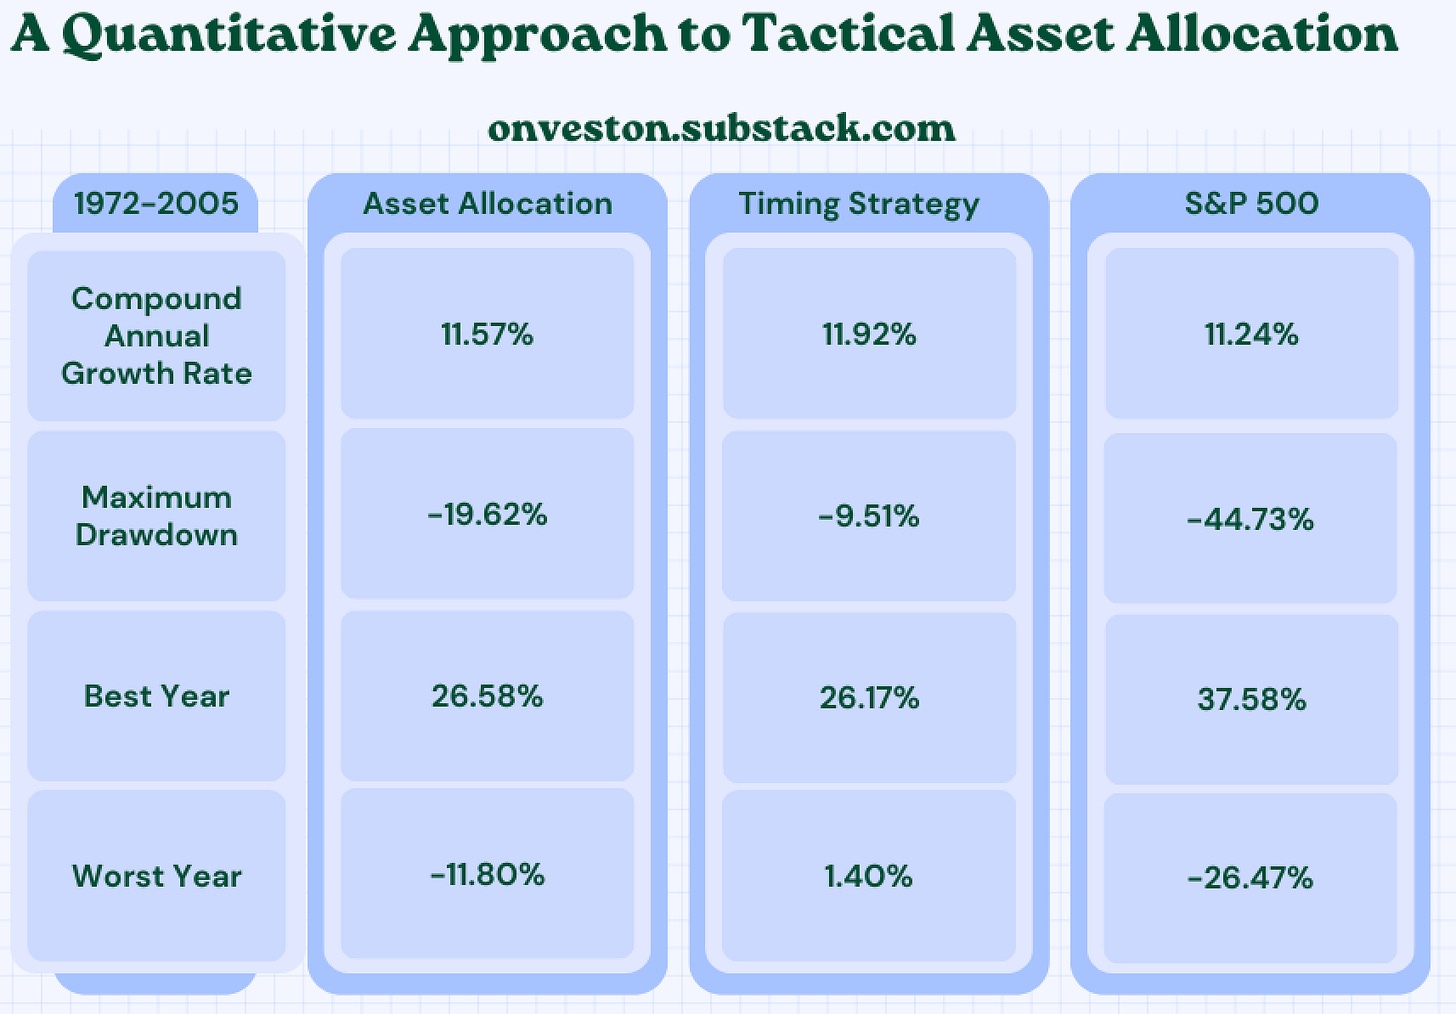
First, let’s compare the S&P 500 SPY 0.00%↑ with the standard asset allocation strategy (20% for each asset class, buy & hold). We see a clear improvement in risk. While the S&P 500’s worst drawdown was -44.73% the mixed portfolio only lost -19.62%. The total return was also higher by 0.33% although the goal of the strategy is to reduce risk and not to outperform.
The results got even better when the timing strategy was used. Not only did the growth rate add up to 11.92% per year, but the worst drop during market selloffs was less than 10%. And the icing on the cake is that it never ended a year with a loss.
Because the timing strategy treats each asset class independently the portfolio is not invested the whole time, giving investors the opportunity to sit with cash on the sidelines when panic spreads across each asset class. Below you see the number of months in which various assets were held. It is evident that the system keeps the investor 60-100% invested the vast majority of the time.
Lessons:
The fact that the normal buy-and-hold portfolio did better than the S&P 500 even though its assets were pretty simple and were not chosen based on other factors that affect returns, such as value, small caps, etc., shows how important it is to diversify. This is true not only for different types of assets, but also for different industries, countries, business models, and different sizes of companies.
A well-balanced portfolio is less likely to be caught off guard by changes in the market. Because of this, I don't like investing in "This is the next xyz." If too much of your portfolio is in, say, semiconductors, and just one company lowers its guidance, guess what happens to your portfolio? The whole sector is sold off, and your portfolio will go down with it. Will you keep your cool if you're in the red?
You see this clearly in the example above, a simple diversification vs. a U.S. stocks-only portfolio not only gave investors slightly better results, but the losses were drastically reduced.
The primary objective of the mentioned paper is to present a straightforward method for managing risk within asset classes and portfolios.
By employing this system, investors have been able to enhance their risk-adjusted returns through the dual strategies of asset diversification and market timing.
The result is a portfolio with bond-like volatility and equity-like returns.
I hope you learned something new today.
Until the next issue. 👋
If you want to know more about similar strategies in the future, let me know by clicking the “Like” button ❤️.
And if you aren’t a subscriber yet, then sign up below to not miss out on future articles.
Disclaimer: This analysis is not advice to buy or sell this or any stock; it is just pointing out an objective observation of unique patterns that developed from my research. Nothing herein should be construed as an offer to buy or sell securities or to give individual investment advice.


Love the Onveston Letter!! It is a wealth of information!!
Why are you linking drawdown to risk? Are the two really related to you?