Dear Investor,
I strongly believe in emotion-free investing. Focusing on the facts in front of you and assessing how they impact a company’s performance leads to better results than relying on hopes for the company’s future.
In a previous article, I introduced one of the key ratios I use when analyzing stocks:
The Capex-to-Cash Flow Ratio
If you're new to this publication, you can find the full article below:
After I published the article, a reader ran a backtest of this ratio and shared the results with me (shoutout to you if you’re reading this 🥂).
Today, I want to share those results with you.
A backtest should answer two key questions:
Does the strategy or ratio work well enough to use?
If yes, how well does it perform, and how quickly do we see results?
It’s also important that a backtest makes logical sense.
For example, testing stocks that start with the letter “A” might show strong performance because companies like Apple AAPL 0.00%↑, Alphabet GOOG 0.00%↑, and AutoZone AZO 0.00%↑have been big winners over the last 20 years.
But choosing stocks this way doesn’t make sense - it’s not a logical selection criterion, even if the backtest looks good.
So, the real question we’re asking today is this:
Does the CapEx-to-Cash Flow Ratio perform well enough to justify using it in our analysis?
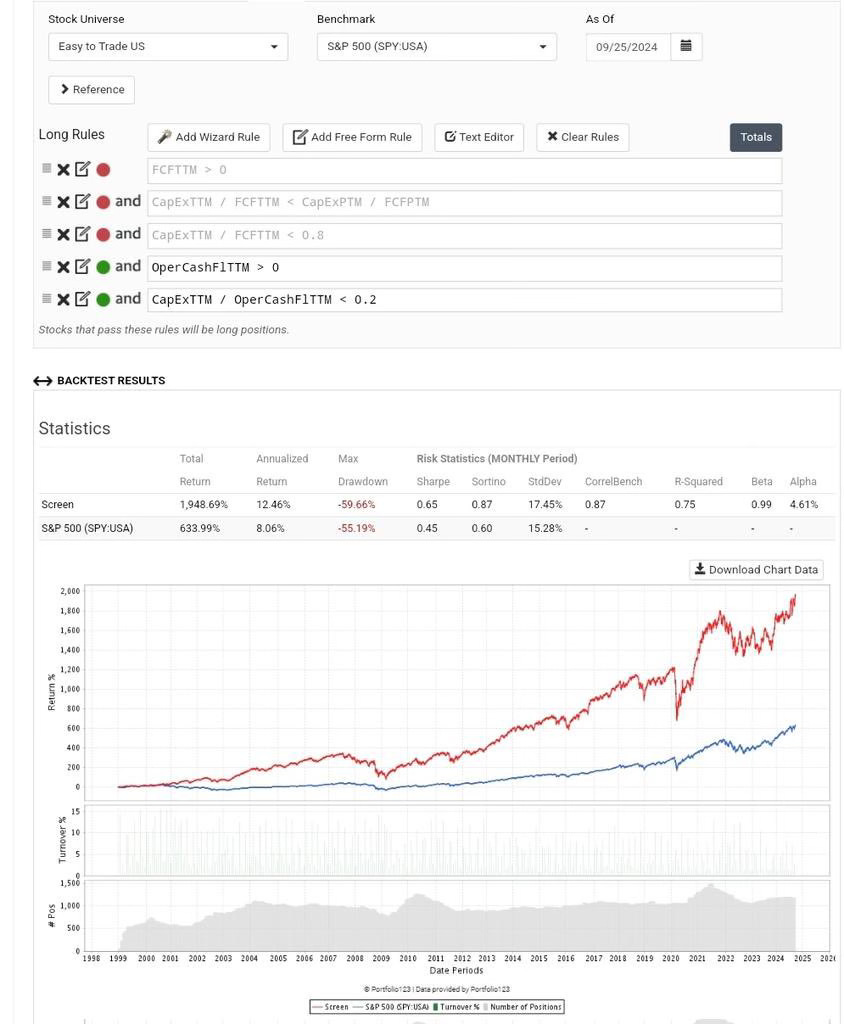
Here are the rules for this backtest:
The stock must be “easy to trade,” meaning it’s listed, priced above $3, and has a median daily dollar volume over $50,000. MLPs are excluded.
The company’s Cash Flow from Operations must be greater than $0.
The CapEx-to-Cash Flow Ratio must be below 20%.
The benchmark for comparison is the S&P 500.
Here are the results:
Over the past 25 years, using this ratio as a standalone selection criterion in the chosen stock universe would have delivered an annualized return of +12.46%, compared to +8.06% for the S&P 500.
That’s an impressive outperformance of +4.61% per year.
While you might not replicate these exact results due to high turnover and a large number of stock positions, the key takeaway is clear:
The ratio works well and should be part of any stock analysis.
The high turnover, with around 1,000 positions, actually strengthens the test. It shows that the ratio performs consistently because it eliminates unrelated factors that could skew results if only a few stocks were tested.
Testing with a larger stock pool ensures the focus stays on the factor being measured, rather than individual companies.
These results shouldn’t come as a surprise. They confirm what you likely already suspected:
Capital-light businesses outperform capital-heavy ones.
That’s it for today.
If you want more backtests of other factors in future article, then let me know by hitting the LIKE ❤️ button.
Merry Christmas, until next time. 🥂
Premium Content 📈
I buy individual stocks for my own portfolio and I analyze individual stocks for my clients.
Elite companies with elite management and unique products are the ones that perform the best - all you have to do is give them some time.
Every few weeks, I introduce a handpicked stock that stands out for its strong fundamentals, competitive moat, and growth potential.
Backed by in-depth analysis, each recommendation is carefully chosen to help you build wealth sustainably over time.
Don’t just follow the market - get ahead of it with strategies tailored for serious, patient investors who seek consistent, long-term success.
To give you a taste of what to expect, here is the CapEx to Cash Flow Ratio for the stock from the Onveston Report #1 (a software company in the B2B niche):
2015: 8%
2016: 9%
2017: 11%
2018: 8%
2019: 6%
2020: 6%
2021: 6%
2022: 6%
2023: 5%
2024: 5%
To get access to the report of this elite business, click the link below:
And here is the CapEx to Cash Flow ratio for the stock from the Onveston Report #2 (a microcap food producer):
2014: 3%
2015: 22%
2016: 10%
2017: 96% (they were building a new production facility due to higher demand)
2018: 21%
2019: no data available
2020: 12%
2021: 5%
2022: 22%
2023: 5%
To get access to the report of this elite business, click the link below:
The third report is almost ready and will go out within the next days. Stay tuned!
If you enjoy The Onveston Letter, let me and the algorithm know by clicking the “Like” button ❤️.
And if you aren’t a subscriber yet, then sign up below to not miss out on future articles.
For new readers: Check out all my previous posts here
Disclaimer: This analysis is not advice to buy or sell this or any stock; it is just pointing out an objective observation of unique patterns that developed from my research. Nothing herein should be construed as an offer to buy or sell securities or to give individual investment advice.
(Social media thumbnail by Dall-E)


